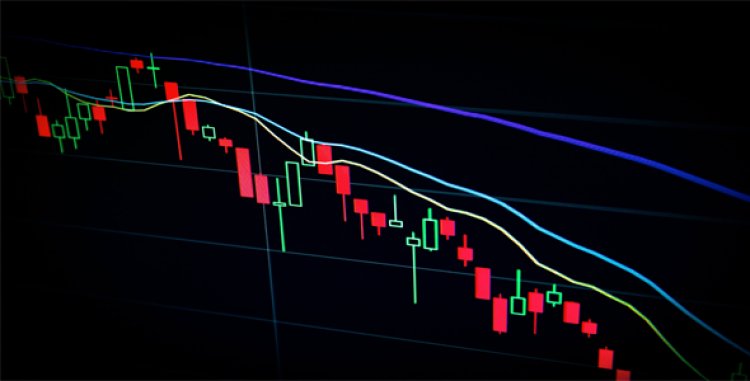
H4 Bollinger Band

H4 Bollinger Band
This strategy is extremely simple; It is used to detect opportunities and it is very good.
Currency Pairs : Any
Chart : H4 (4 Hours)
Indicators : Bollinger Band (20)
If you open a EUR / JPY H4 chart and insert the Bollinger Bands indicator (20), you will notice that the bands are simply a Resistance and a Support.
The Upper band is a Resistance and the Lower Band a Support . If you pay attention to the chart, you will see that most of the time the price reaches the upper band, then returns to the lower band; Taking this into account, the way to operate is very simple: you must wait for the price to touch, for example, the upper band and close below it (not above) and then wait for the candle to form.
When it ends and the next candle opens below the previous upper band, then enter a short trade with a target of 100 basis points, or until it hits the lower band .
It is the same for when the lower band is touched and the candle closes above it; The next candle opens above the previous lower band and a buy is made with a target of 100 basis points or the upper band.
You can develop this strategy and make a lot of profit.
- PART II
Currency Pair : Any
Chart : H4 (4 Hours)
Indicators : Bollinger Band (20)
This strategy is a continuation of the previous one and is very simple. First, open a currency (for example EUR / USD) and an H4 time frame. Cast proper breaklines from the Bollinger band and wait for the candle to break the breakline. This breakout is not a trade signal so extra confirmation is needed. This is where the Bollinger band comes in.
See the upper and lower Bollinger bands. If both are open (that is, each band is moving away from the other), which means that the upper band is UP and the lower band is DOWN, then this is a confirmation of a trade.


